The 65+ age group was the fastest growing age group, while people aged 15-24 years experienced the lowest growth, thus highlighting the ageing population in Greater Perth.
2016 FAMILY STRUCTURE – GREATER PERTH

Source: ABS, PVA(WA) Research
The average number of persons per household is 2.6, which is the same as Western Australia and Australia in total. Family households account for 73.0% of all households, with 37.5% couple families without children; 46.3% couple families with children; 14.5% one parent families; and 1.8% other family structures. Of the single parent families, 82.1% are female and 17.9% are male.
DWELLINGS
Dwelling Structure
In 2016 there were 776,014 dwellings in Greater Perth, of which 85,730 were unoccupied (11.0%). This unoccupied proportion has increased from 9.6% in the 2011 Census and is in line with the national average of 11.2%. The number of occupied dwellings has increased by 10.1%, compared with an increase of 6.1% nationally. Of the occupied dwellings:
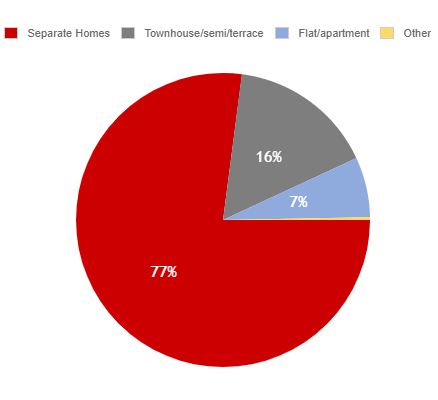
Source: ABS, PVA(WA) Research
Separate houses are the most prominent dwelling type (76.9%). The predominant growth in dwelling structure over the five year period is that of townhouses/semi-detached housing/terraces, which has grown from 9.1% of occupied dwellings to 16.0% between 2011 and 2016.

Source: ABS, PVA(WA) Research
The most prominent number of bedrooms is four or more (45.2%), and the average number of bedrooms per dwelling remained the same over the five years to 2016 at 3.3.

Source: ABS, PVA(WA) Research
The most prominent tenure type is owned with mortgage (41.9%). The number of dwellings owned with a mortgage has increased since 2011 by 15.9%.
INCOMES
The following table shows median weekly income levels in 2016, which in Greater Perth are higher than both state and national averages.